
App Usage & Subscriptions
Which apps and digital services people use, pay for, churn from, and stack, including streaming, delivery, gaming, fitness, finance, and more.



















How it's collected

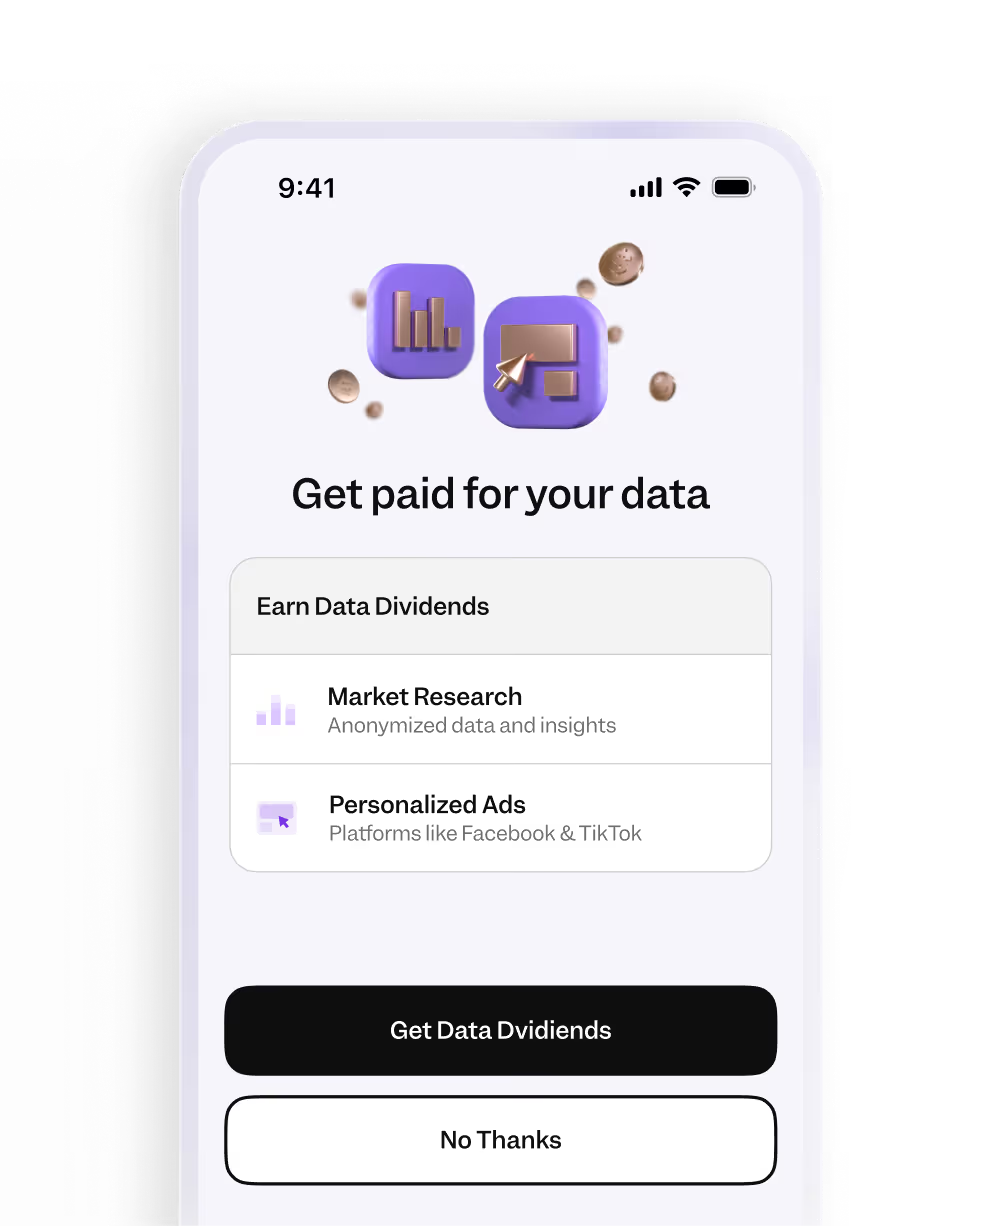
User consents to app usage sharing in Pogo
App usage data sharing is a separate, explicit consent layer within the Pogo app. Users understand what app activity is captured and how it's used before opting in.
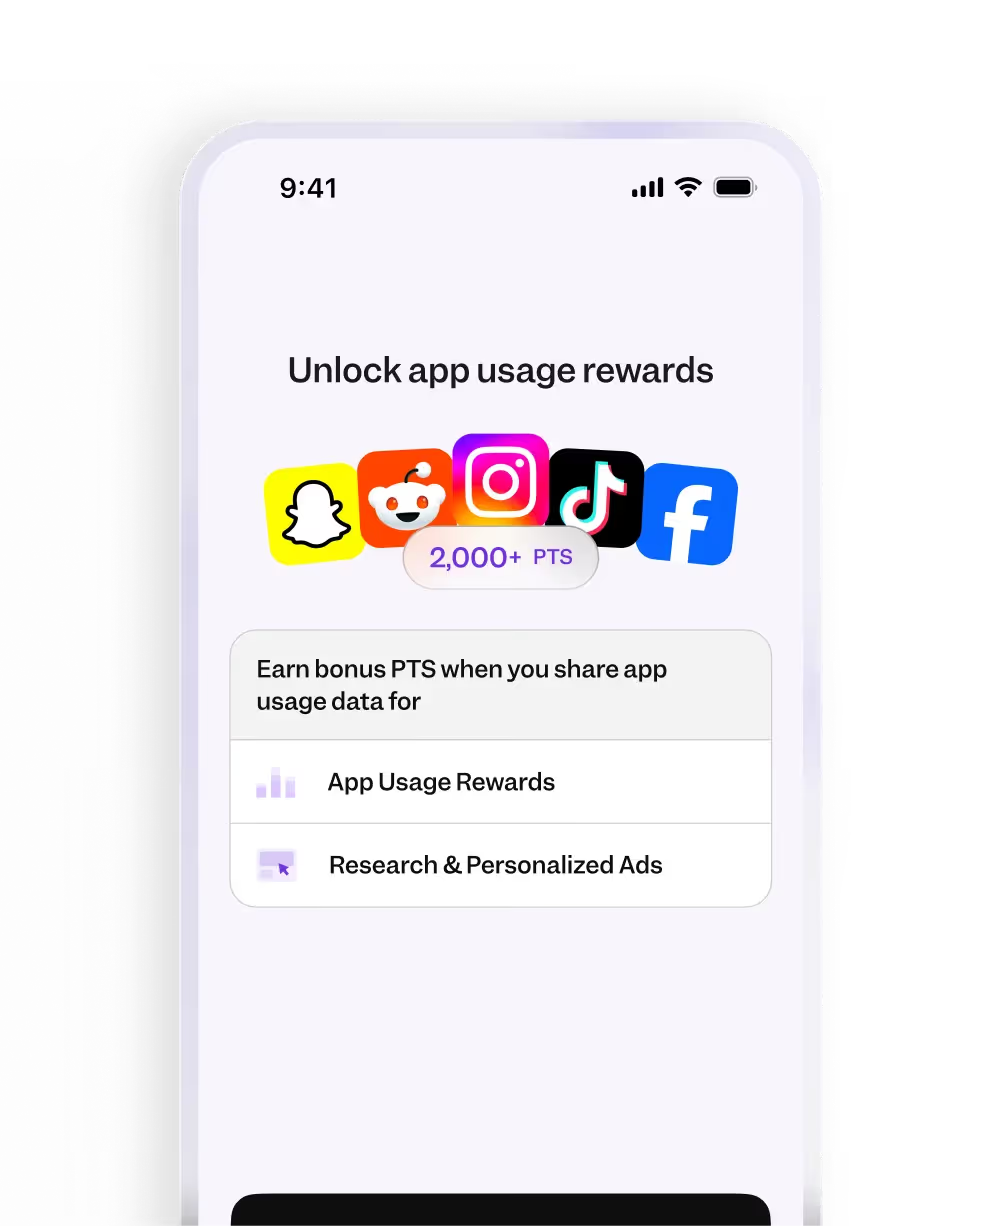
App activity and subscription status are captured
Pogo tracks app sessions and engagement signals from users who have opted into app sharing. Separately, recurring charges and subscription fees detected from linked financial accounts confirm paid subscription status.
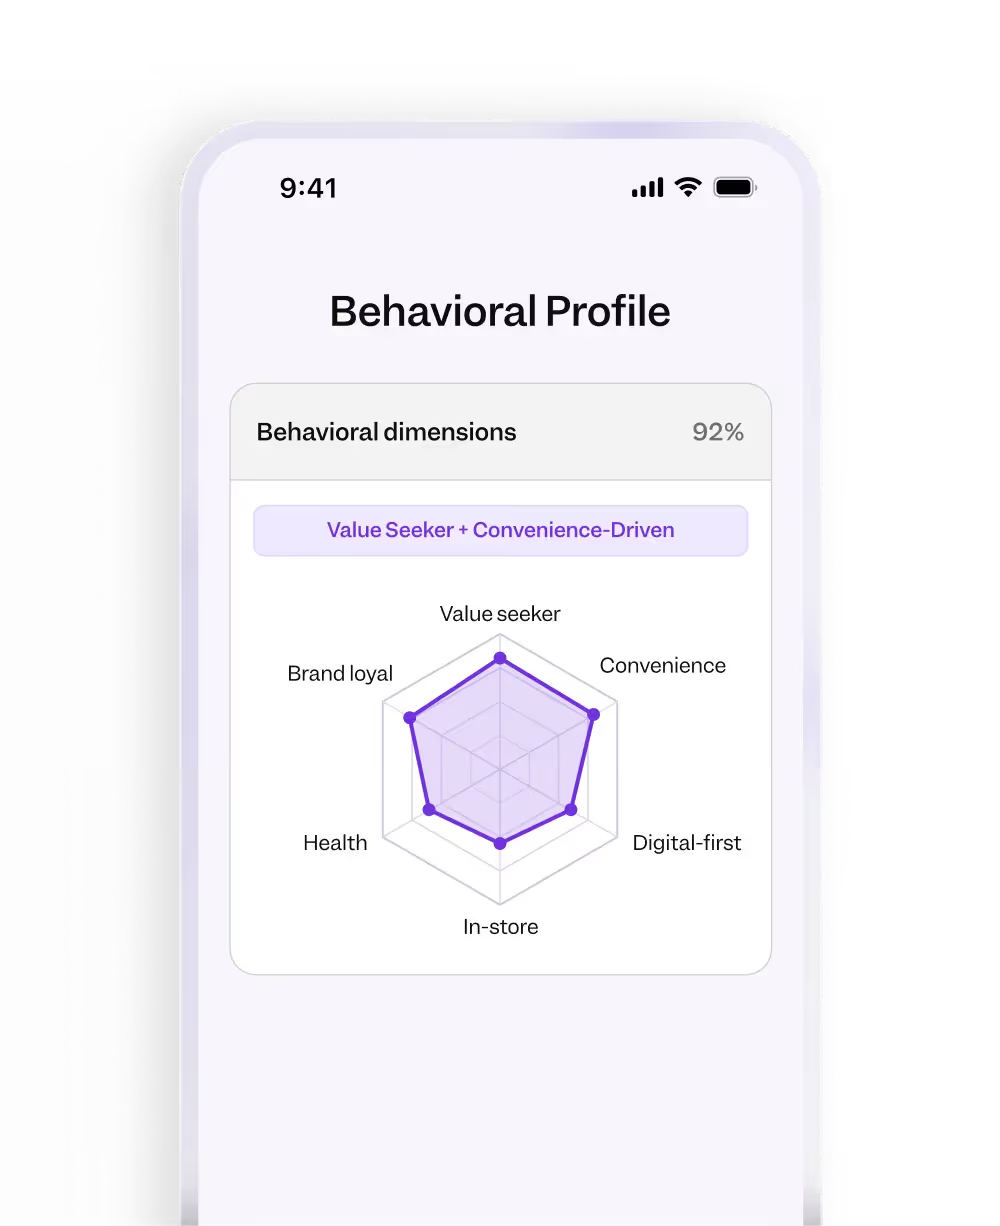
Data is enriched with behavioral context
App usage signals are joined with purchase and financial data to reveal how digital spend and physical consumption interact: which subscribers to a delivery app also buy in-store, which streaming subscribers are financially stressed, and more.
User consents to app usage sharing in Pogo
App usage data sharing is a separate, explicit consent layer within the Pogo app. Users understand what app activity is captured and how it's used before opting in.
App activity and subscription status are captured
Pogo tracks app sessions and engagement signals from users who have opted into app sharing. Separately, recurring charges and subscription fees detected from linked financial accounts confirm paid subscription status.
Data is enriched with behavioral context
App usage signals are joined with purchase and financial data to reveal how digital spend and physical consumption interact: which subscribers to a delivery app also buy in-store, which streaming subscribers are financially stressed, and more.
Example products powered by this data


Identify users who recently churned from or switched to a competitor app, then run AI-moderated interviews immediately. Understand switching triggers, unmet needs, and competitive perceptions from verified app users.

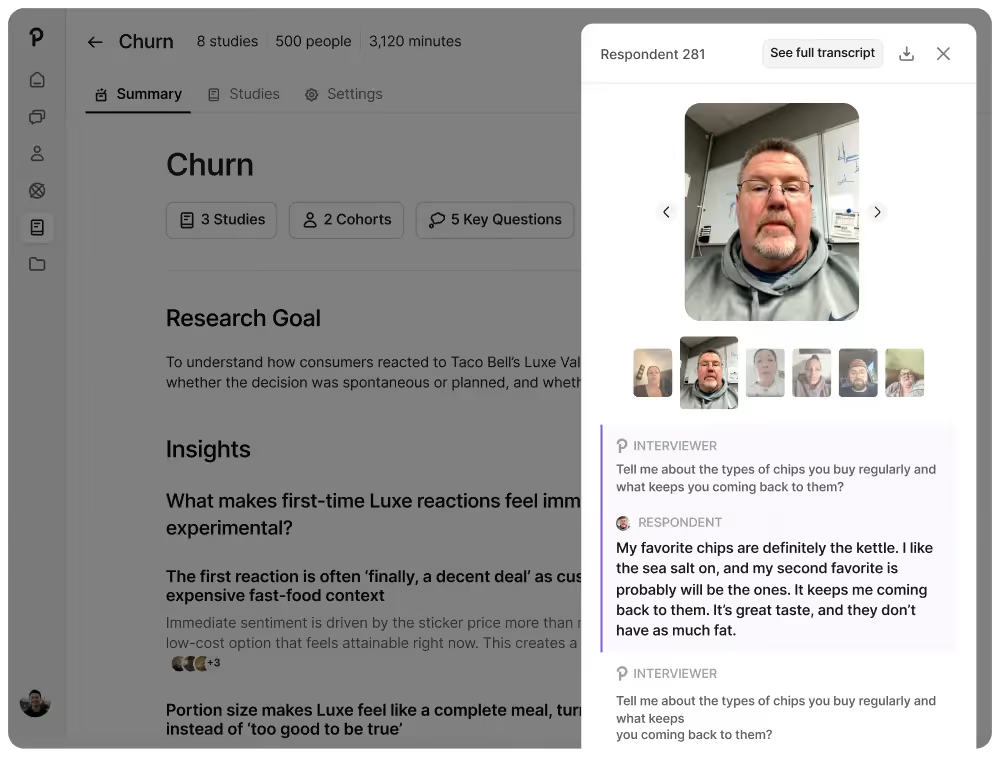
Survey confirmed subscribers to specific apps or platforms, defined by actual subscription charges, not self-reported usage. Ideal for competitive positioning, feature prioritization, and churn risk studies.
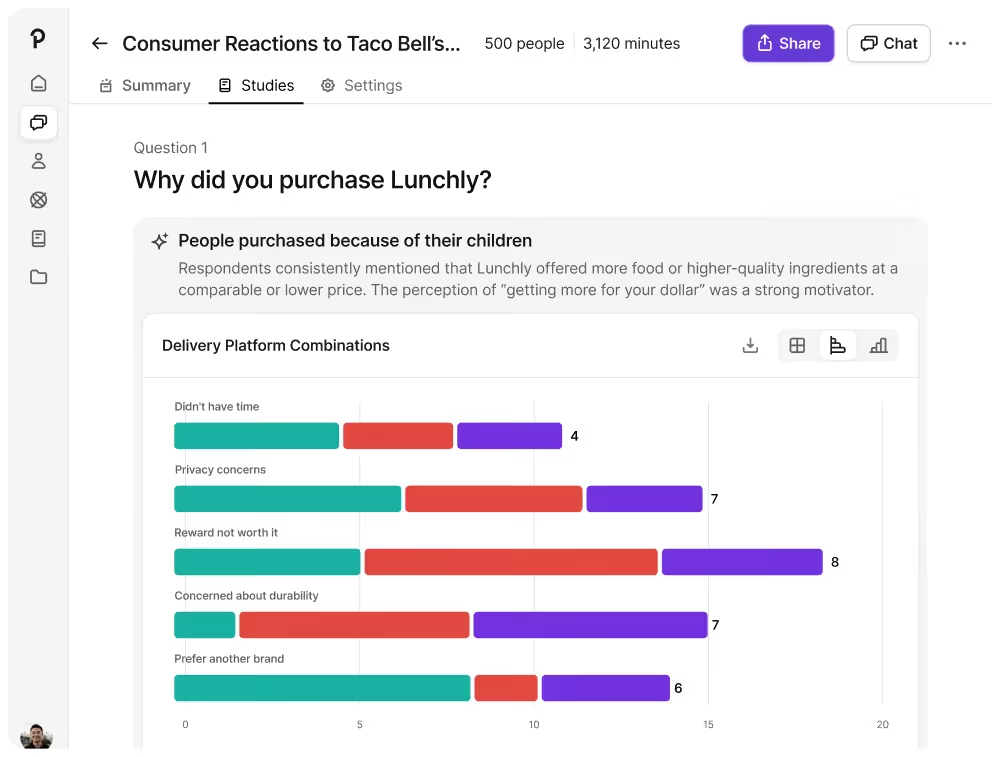
See which delivery, streaming, fintech, or gaming apps your users also pay for. Understand stack composition, multi-homing patterns, and which services get dropped first under financial pressure.
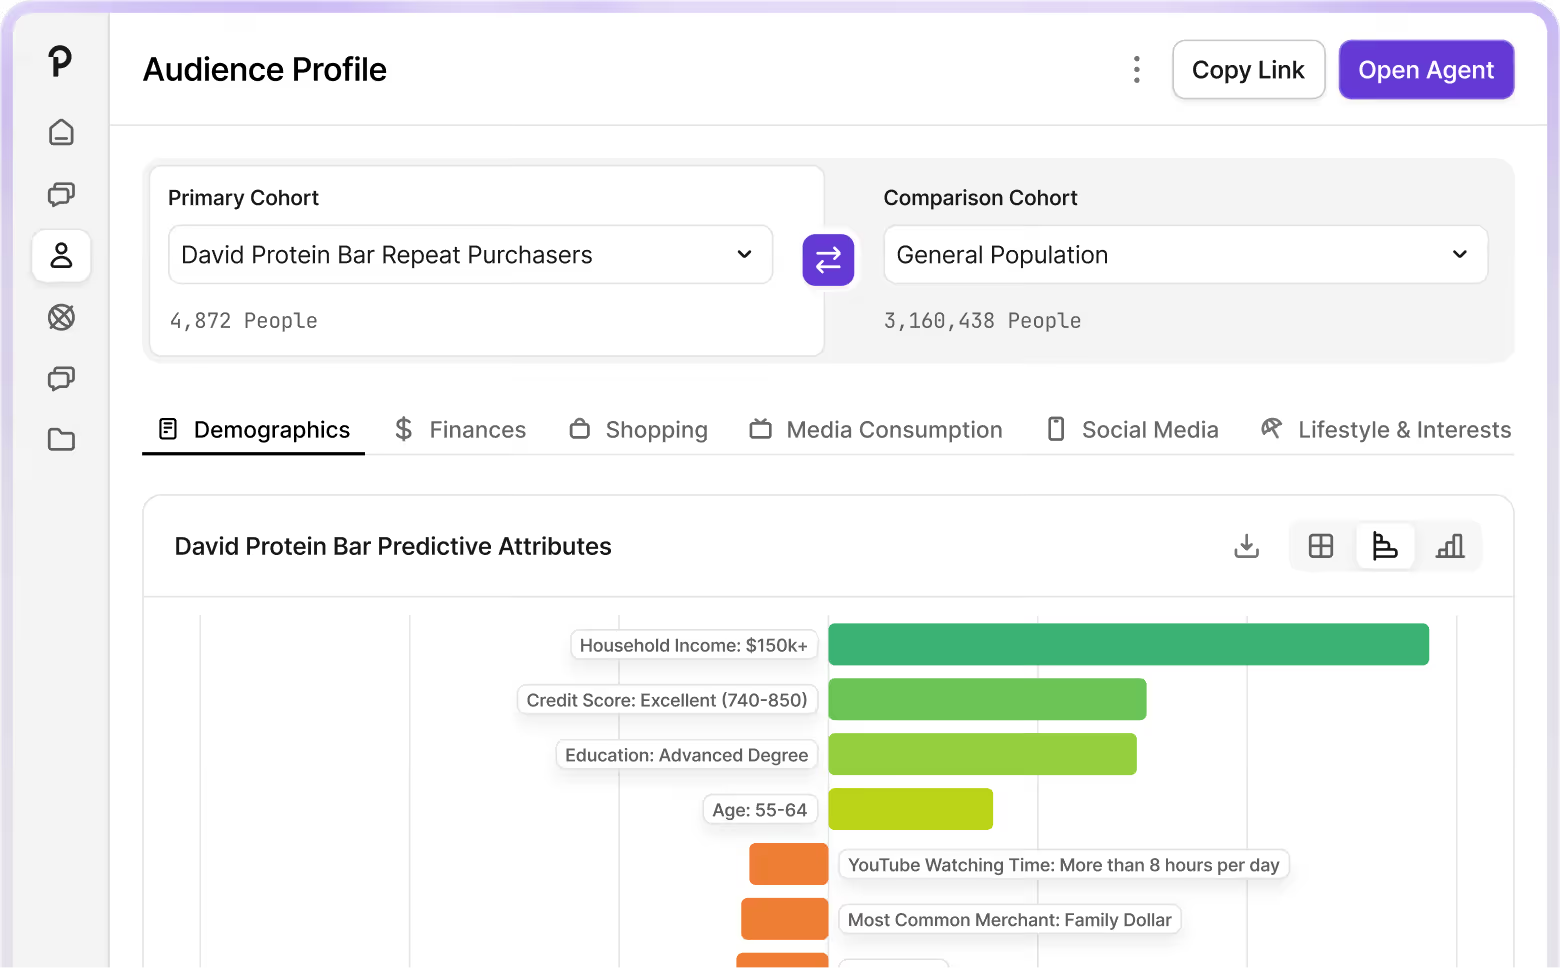
Access subscription status and digital spend feeds across app categories: platform growth signals, subscriber churn rate tracking, and stack composition data.
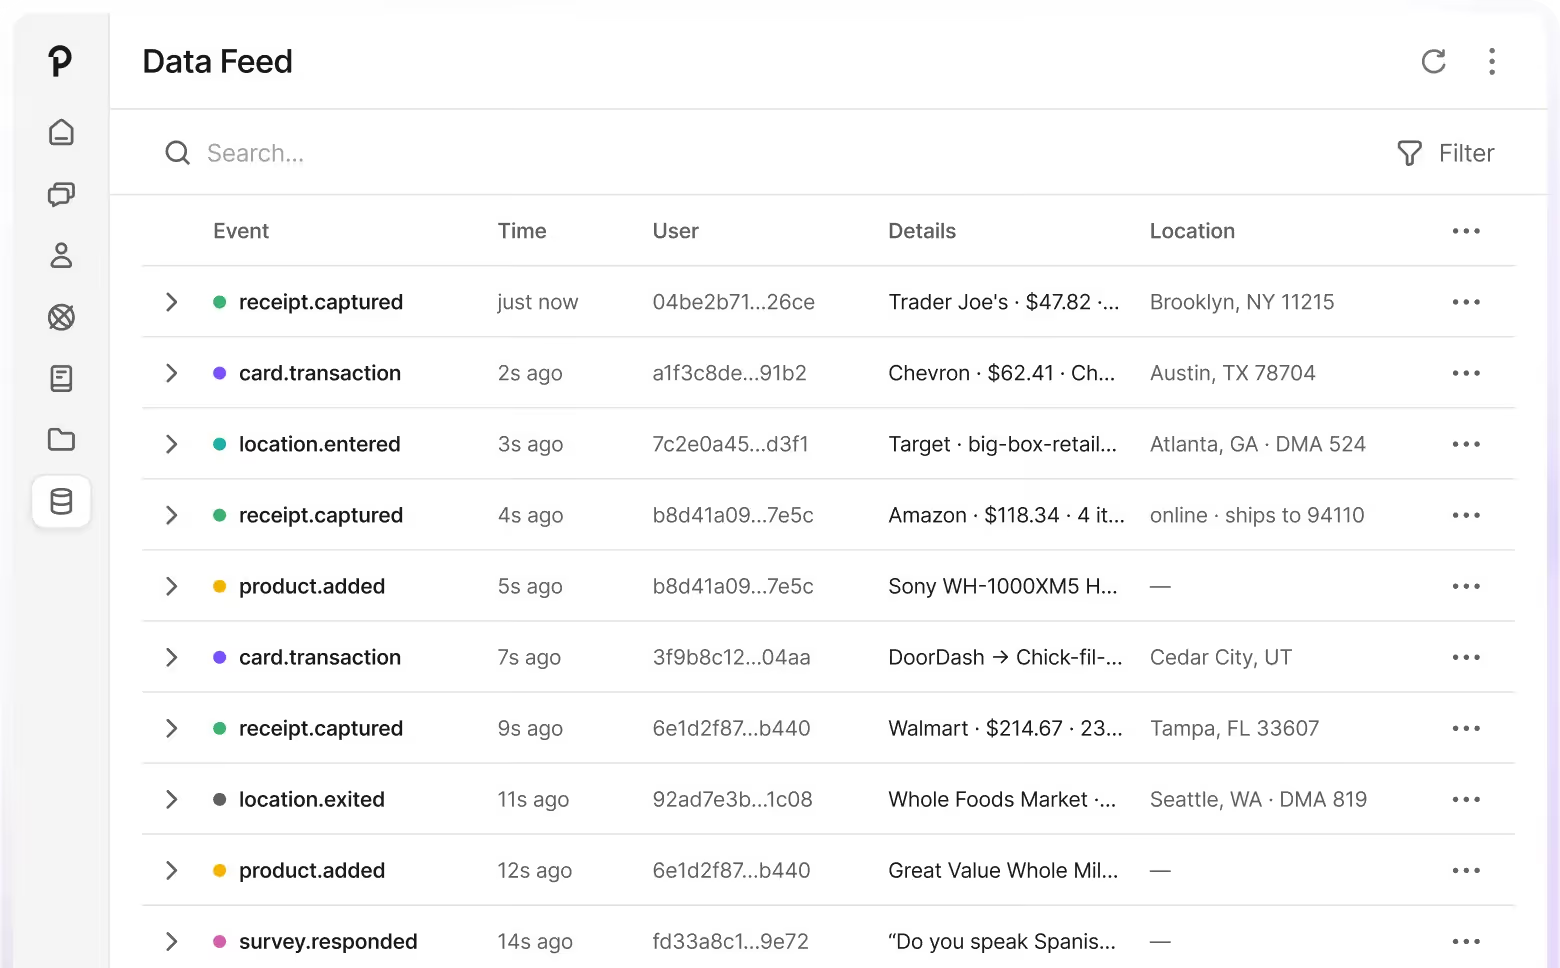
Identify users who recently churned from or switched to a competitor app, then run AI-moderated interviews immediately. Understand switching triggers, unmet needs, and competitive perceptions from verified app users.
Survey confirmed subscribers to specific apps or platforms, defined by actual subscription charges, not self-reported usage. Ideal for competitive positioning, feature prioritization, and churn risk studies.
See which delivery, streaming, fintech, or gaming apps your users also pay for. Understand stack composition, multi-homing patterns, and which services get dropped first under financial pressure.
Access subscription status and digital spend feeds across app categories: platform growth signals, subscriber churn rate tracking, and stack composition data.
Used by any industry


Learn whatreal people actually think and do
Book a demo to learn about verified research and setting up test studies
Sign up for our consumer insights reports